1. Main menu bar

PROJECT
ADVANCED (in PRO version)
Allows a full simulation period of up to 365 days.
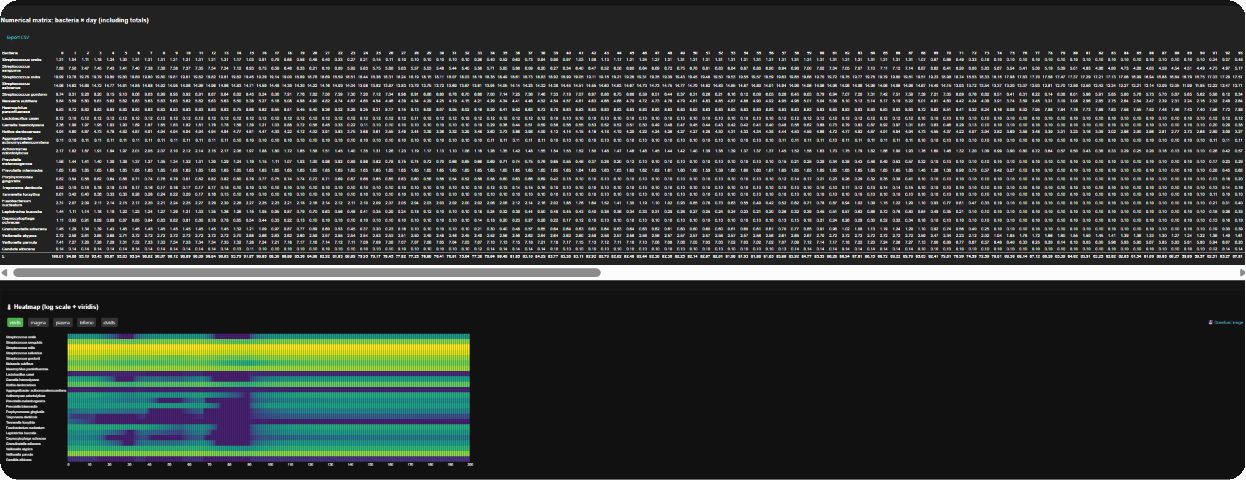
The Analytical Tools button provides direct access to data from the computational matrix and allows it to be exported as a CSV file. Various types of scientific heatmaps are also available.
DATA
SETTINGS
Project folder setting - set directories for your data
Mode: Dark(default) / Light
Help tooltips: ON/OFF
SUBSCRIPTION
Plans and pricing
Refund policy
Download pricelist
INFO
Read me
About: summary info about the simulator
Privacy policy
Terms of use
Refund Policy
Manual
Manual for download
2. INPUTS
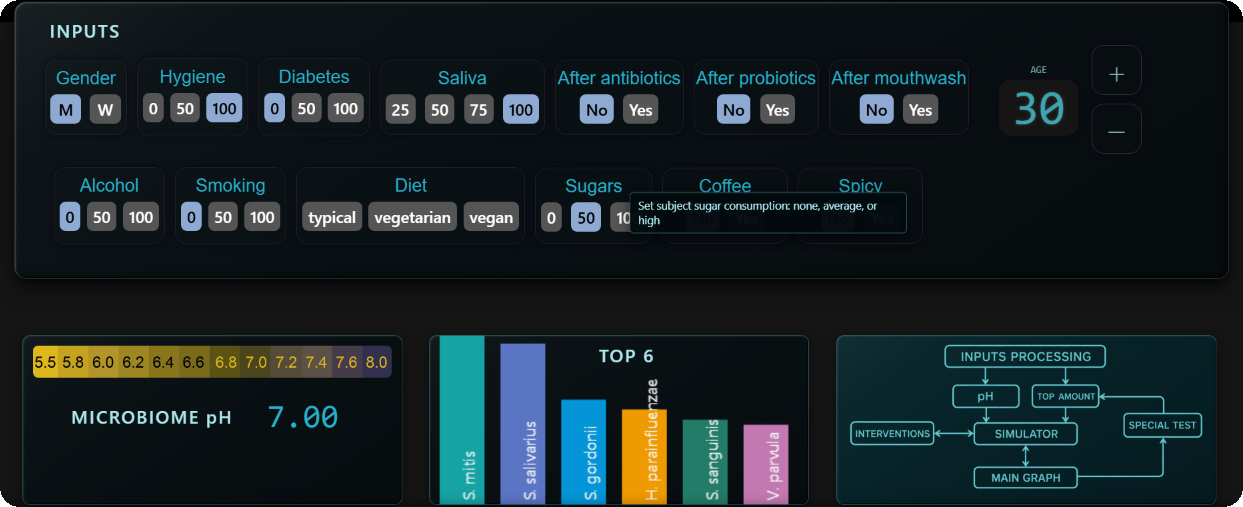
The simulator inputs are preset to represent an ideal state: a healthy 30-year-old male with an ideal lifestyle, 100% oral hygiene, and balanced oral pH and bacterial composition.
All input data can be freely adjusted, and you can observe the effect of these changes on the pH value and the relative abundance of bacteria.
Right side – Age: controlled using the rotary dial or buttons (buttons only on touch devices).
Left side:
M / F
(from age 12 the option for Pregnancy appears, from age 45 the option for Menopause appears.)
Hygiene: 3 levels of oral hygiene • 0 = none • 50 = medium • 100 = excellent
Diabetes: • 0 = none • 50 = mild • 100 = severe
Saliva: salivary flow • 25 = insufficient • 50 = poor • 75 = average • 100 = excellent
After antibiotics: important for correct microbiome modeling — was any antibiotic used in the past 14 days? (Yes / No)
After probiotics:important for correct microbiome modeling — was any probiotic used in the past 14 days? (Yes / No)
After mouthwash: was any mouthwash used in the past 7 days? (Yes / No)
Bottom row of INPUTS – lifestyle
Alcohol • 0 = none • 50 = occasionally • 100 = frequent
Smoking • 0 = none • 50 = occasionally • 100 = frequent
Diet: typical / vegetarian / vegan
Sugars: 0 = none • 50 = medium • 100 = high Coffee: Yes / No
Spicy: Yes / No
ORAL pH
On application start the display shows 7.00, which corresponds to the preset ideal state. Any change in the input data is immediately recalculated into a new value. By clicking on the numeric color strip you can, after confirmation, enter any chosen value or an actual value measured with a test strip, which will then be included in the simulation.
MINI GRAPH
Displays the 6 currently most abundant bacteria in the microbiome. Their order changes according to the calculations based on the given inputs. When hovering with the mouse or tapping with a finger on the bar, basic information about the selected bacterium is shown.
DATA FLOW DIAGRAM
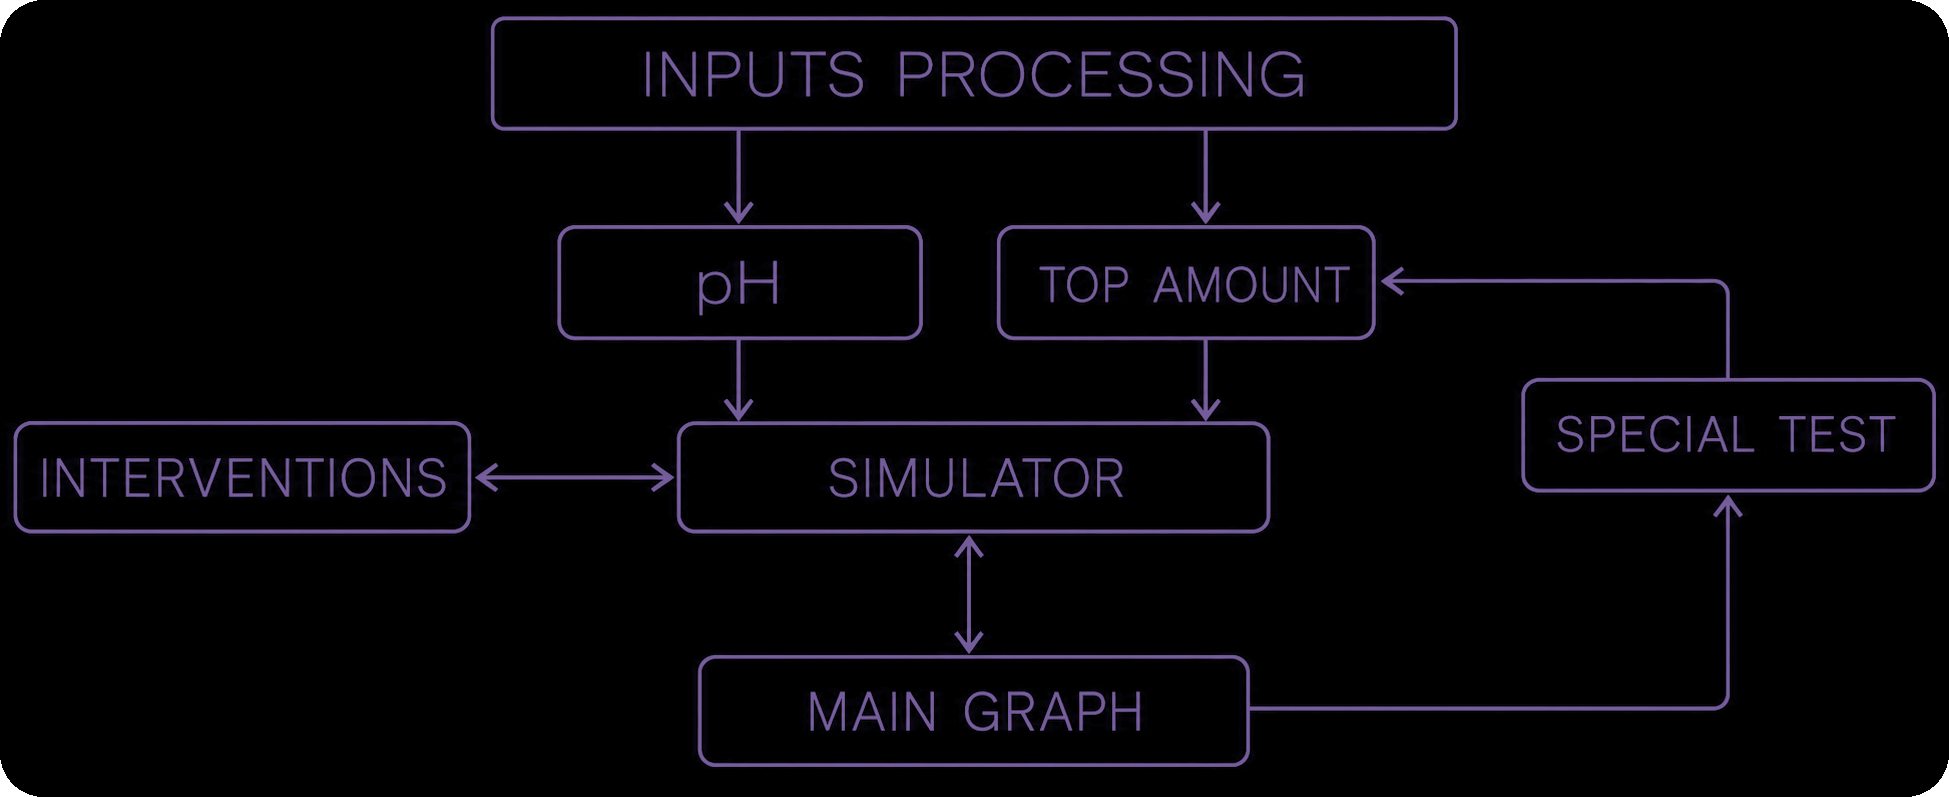
Orientation schema.
3. MAIN CHART
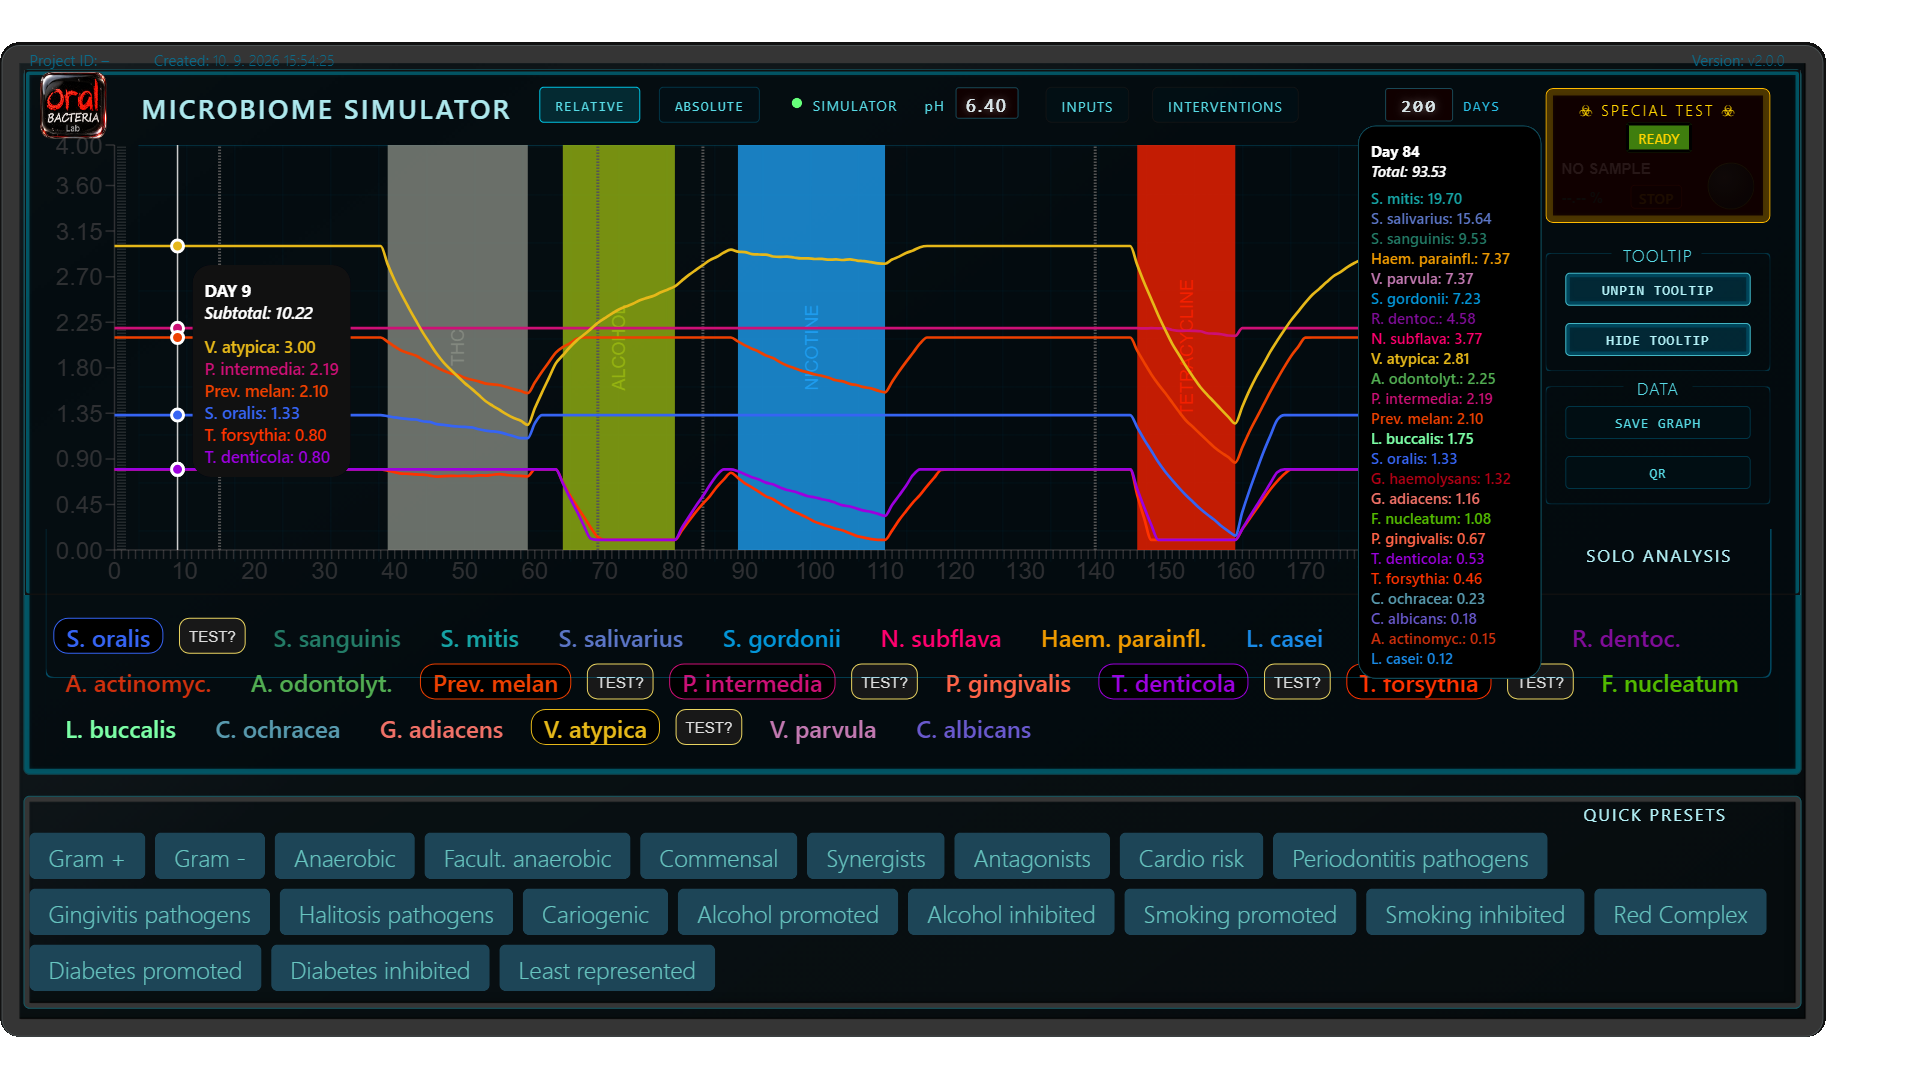
The main chart displays, in its basic configuration, the lines of all bacteria according to their assigned colors and their relative abundance in the microbiome over a span of 30 days (in the PRO version up to 365 days).
Within the chart area a detailed tooltip appears showing the current values of all bacteria. This tooltip can be pinned into the left corner of the chart, unpinned with the left button below the chart, or hidden with the right button below the chart. The pinned tooltip is included in the snapshot. Snapshots can also be saved by right-clicking the graph.
MAIN CHART — TOP CONTROL BAR

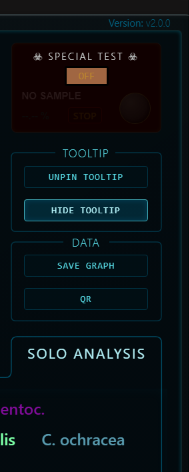
A new advanced Special Test function has been implemented in the right-hand corner of the main graph. It enables unique testing of the entire microbiome response to a hypothetical change in the abundance of any single selected bacterium. The selected bacterium can also be hypothetically removed from the microbiome entirely.
When Special Test is activated and set to READY, a TEST? button appears next to bacteria selected by any method in the SOLO ANALYTIC section. After confirming one of them, its abundance can be controlled using the dial in the Special Test section. The resulting changes are immediately reflected in the behavior of the entire microbiome and in the rearrangement of the auxiliary TOP6 graph.
TOOLTIP
UNPIN TOOLTIP — removes the currently pinned tooltip from the graph.
SHOW TOOLTIPS — shows or hides graph tooltips.
DATA
SAVE GRAPH — saves a snapshot of the current graph.
A new option allows you to right-click anywhere within the graph to save a snapshot of its complete current state, including the currently displayed data and pinned tooltip.
QR code creates and dislpays a QR code containing the complete simulation data.
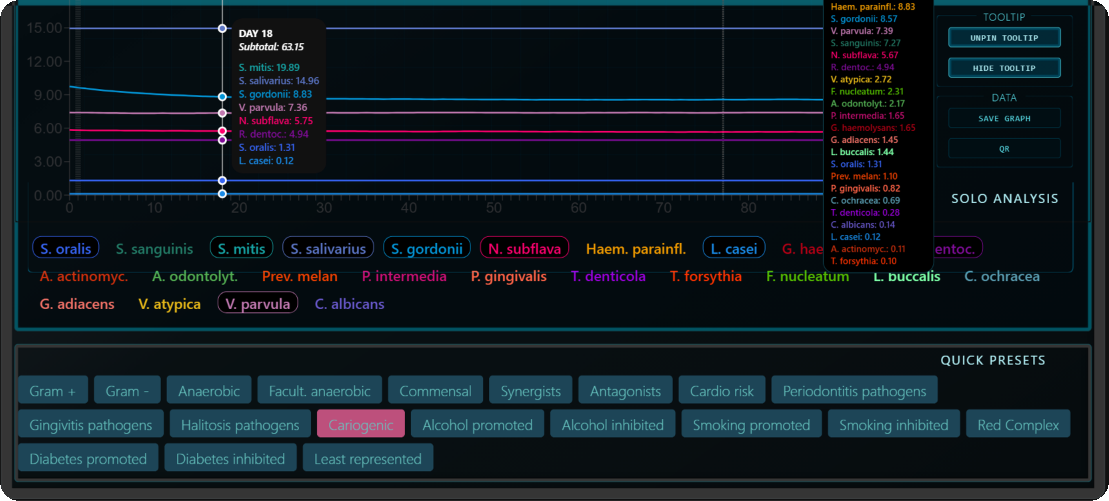
SOLO ANALYSIS: a group of buttons representing all 24 main organisms included in the model. It allows one or more bacteria to be selected for individual monitoring in any simulation mode.
The QUICK PRESETS buttons provide predefined sets of bacteria grouped according to their properties and classification. From the currently selected bacteria, a single organism can then be chosen for the SPECIAL TEST.
4. Microbiome interventions:
(In the Basic version, only the Basic group of buttons is functional)
50 active substances are divided into the following groups:
Basic:
Honey, Nicotine, Menthol, Curcumin, Capsaicin, Alcohol, CHX (Chlorhexidine)
Common:
Xylitol, Propolis, Baking soda, Tea tree, Green tea, Coconut oil, Ascorbic acid (Vitamin C), Acetic acid (Vinegar), Salicylic acid
Extra:
Naringin (from grapefruit seeds), Artemisia (wormwood – various species), Manuka honey, Chitosan (crab shell extract), Eugenol (clove extract), Chewing tobacco (short-term), Chewing tobacco (long-term), Farnesol (propolis extract), Red wine polyphenols, Myrtle & pomegranate polyphenols
Special:
Cortisol, Flurbiprofen, Benzydamine, Nystatin, Zinc, THC (Cannabis), CBD (Cannabidiol from cannabis), Copper, Fluoride, Iodine, Lysozyme
Probiotics:
Streptococcus salivarius K12, Weissella cibaria, Streptococcus salivarius M18, Lactobacillus reuteri, Lactobacillus plantarum & L. rhamnosus (brand names not listed)
Antibiotics:
Penicillin, Tetracycline, Macrolides, Amoxicillin, Amoxiclav, Metronidazole, Clindamycin, Ciprofloxacin, Moxifloxacin.
These substances can be freely selected and applied using graphical sliders over a simulation period of up to 30 days in the Basic version and up to 365 days in the PRO version. The number of simultaneously active substances is not limited.
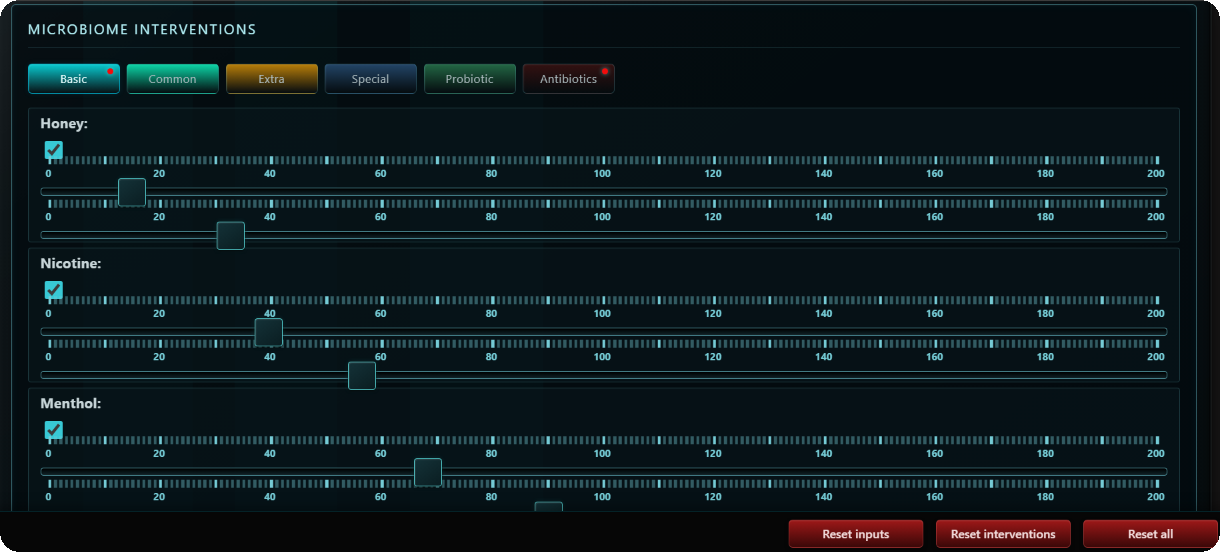
The graph is calculated using a matrix that models bacterial dynamics, including the time required for recovery. The model also incorporates bacterial interactions, including cooperation, competition, and attempts by some bacteria to occupy ecological niches vacated by others. Each simulation day is recalculated from the state of the previous day, and individual interventions may continue to affect the microbiome for several days.
Groups of substances are color-coded and their zones of influence are drawn in the chart during setup. Effect zones may overlap, allowing the combined effects of multiple substances to be simulated.
At any moment of the simulation, all parameters can be modified — individually or entire groups.
Bottom bar
RESET INPUTS and RESET INTERVENTIONS allow direct comparison of simulation scenarios without manually rebuilding the previous settings. RESET INPUTS restores all input parameters to their default values; RESET INTERVENTIONS clears all intervention settings.
After either reset, the button becomes UNRESET. Observe the resulting simulation, then click UNRESET to restore the complete previous state of the corresponding inputs or interventions and compare the results with the original configuration.
RESET ALL performs a final reset and does not provide UNRESET.
This user guide applies to version v2.0.0 and may differ in the future.
© 2026 Martin Laul. All rights reserved.